The UK is the most popular country in the world for spread betting, allowing residents to speculate on either the rise or fall of financial markets. Find out why you might decide to choose spread betting over trading CFDs, and what to consider before you start.
Spread betting is a type of derivatives trading, in which you speculate on the price movements of a financial asset. You can choose from a range of markets when you spread bet – from forex currencies to stocks.
As a spread bet is a derivative, you don’t own the underlying asset and there is no documentation to register the asset in your name. This form of trading is also classed as a type of gambling by the HMRC. Both of these features of spread betting have significant tax implications.
We speak to many different traders as part of our work with SpreadBet, and these tax implications come up time and time again as motivating factors. You won’t pay capital gains tax on any profits you make, and you won’t pay stamp duty because you don’t take ownership of the asset – the tax-free profits make this an attractive option.
Another aspect of spread betting that we personally like is the ability to profit in all types of market. Whether the market is bullish or bearish, you can potentially profit by opting to go long on your bet, or short.
How Does Spread Betting Work?
We mentioned that word “derivative” earlier on. This simply means prices are derived from the underlying instrument.
So when you spread bet, you’re speculating on the movement of that price.
To action a bet, you stake how much you wish to risk per point of movement. You’ll profit from every point the price shifts in your favour.
The total profit is simply the difference between your opening and closing price, multiplied by the stake size of your spread bet.
1. Going Long Or Short In Spread Betting
We recommend that you assess market conditions before placing a spread bet to identify suitable instruments.
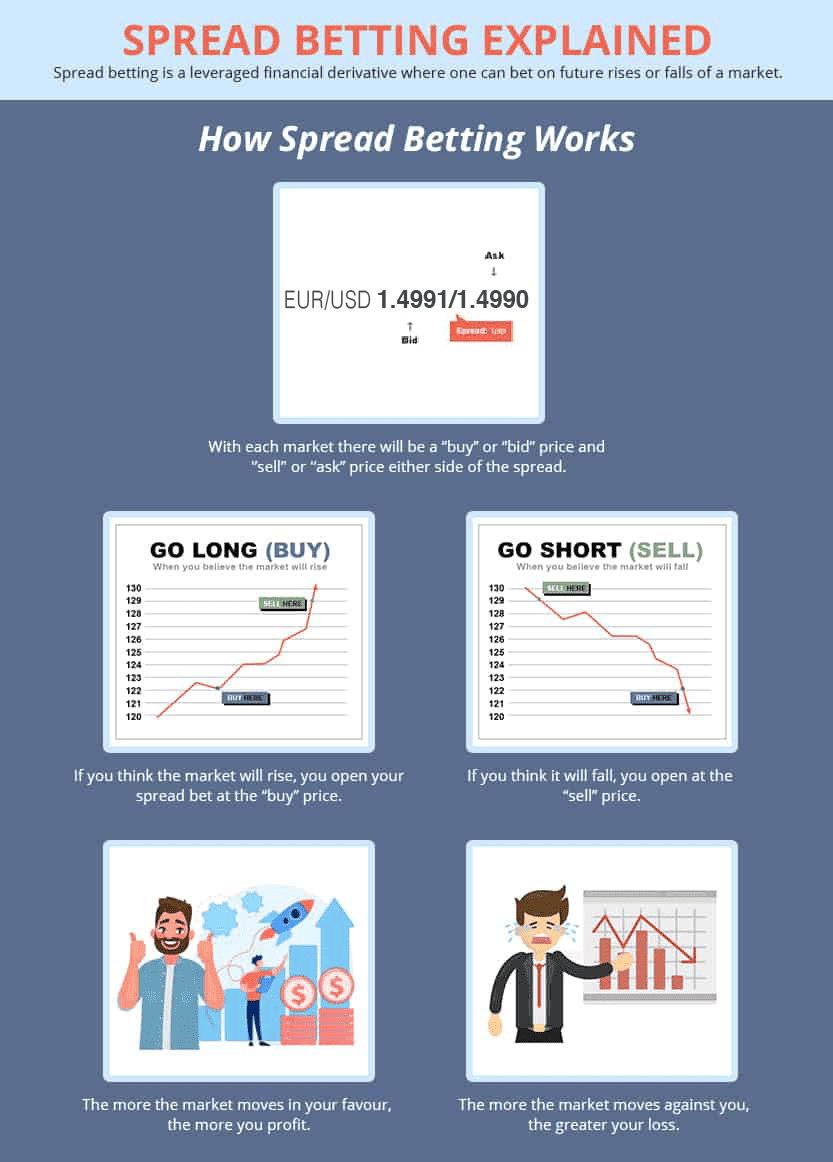
If you believe the instrument will rise in value, you would take a long position – i.e. buy. If you believe it will fall in value, you’d go short, or sell.
2. Size and Duration
Then, you’ll choose your bet size, or stake. This is the amount you wish to risk per point movement, and it will determine how much you profit (or lose) for that single point.
The standard duration of the spread bet is unlimited. You can keep the bet open as long as you like, but you are charged each night the position remains open.
To avoid this charge, you can choose to day trade or scalp, so you never have a position open at the close of a day’s trading. Another method is to bet on the futures market, which reduces the overnight fee but widens the spread.
In our view, the futures market is good for longer-term bets, but keep an eye on those spreads.
3. Leverage And Margin
Spread betting leverage is an important feature. It allows you to maximise your profits by borrowing funds from your spread betting provider.
This way, you can control a larger bet, while only putting down a small amount of your own funds.
Margin refers to the minimum amount of your own funds you’ll need to put down to open the spread betting position.
4. Trading Platforms
To execute your bets, you’ll need to use a spread betting trading platform. Fortunately, your broker will provide access to this for free.
There are plenty of platforms out there, many of which have advanced charting tools and execution methods. Bear in mind that not every platform will be available with every broker.
Our personal favourite platforms are MetaTrader 4, MT5, cTrader, and TradingView, as these will give you everything you need to develop a strong spread betting strategy.
Why Spread Bet?
Many people we talk to in the the UK say they choose to spread bet for the lower trading costs. These savings are due to tight spreads, commission-free trading, and tax exemption.
Unlike other trading products, spread betting is not subject to UK capital gains tax or stamp duty, which can save you a fair bit of money over time.
There are exceptions to this rule, however. Tax treatment depends on whether spread betting is your main source of income. If you are a professional trader, you’ll need to pay income tax on your profits.
Also, if you trade via your own limited company, you’ll pay tax on your profits. These exceptions don’t apply to most retail traders, who will be able to enjoy tax free trading.
Spread betting also helps you save on currency conversion fees. You’ll always be trading in GBP, so you can access popular markets without needing to convert your currency.
Examples: Spread Bet vs CFDs Stocks
In the UK, you can speculate on the markets in a few different ways. We’ve highlighted some useful examples below:
1. Spread Bet Example
Spread betting is a little simpler than other forms of trading, as you control precisely how much you will profit or lose on the best through your stake size. Let’s take a quick look at a spread betting example:
You decide to buy the EUR/USD pair, with a bet size of £1 – so you would profit £1 for every point the EUR/USD moves in your favour.
If you bought EUR/USD at 1.0190, and the value rose to 1.0205, you would have made £15 profit (tax-free). This is a 15 point rise, multiplied by the £1 stake.
If the instrument fell to 1.0175, the opposite would be true. You’d lose £15.
2 . CFD Trade Example
CFDs also involve speculating on a derivative and using leverage. There are some notable differences, however.
For instance, you open a contract, even though you never own the underlying instrument. You also can only buy the asset in lots of a specific size, rather than just choosing your stake size. CFD trading is popular across the world, and is legal in many more countries than spread betting.
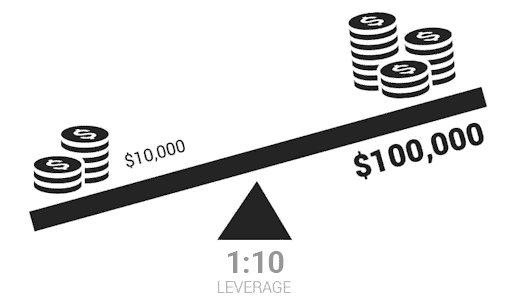
In this example, you buy 10,000 shares in Vodafone (VOD). Each share is worth £0.80p.
You leverage at 1:10 – this is the maximum many brokers will allow you to leverage on share CFDs. So you can put down a margin of £800 to control 10,000 shares of VOD.
Let’s say the VOD enters a bullish run and is now worth £1 per share. You net 20p profit per share.
But because you control 10,000 shares of VOD, this results in a profit of £2,000, after only putting £800 towards it.
When you close the position on a profit, you will pay a commission of 0.1% on the whole position. As the full leveraged position is now £10,000, the commission is £100.
In addition, you will be subject to CGT, which could be up to 20% of the profit made. So your overall profit would be:
£10,000 – £8,000 – £100 – £8, giving you a net profit of £1,892 before tax.
3. Stock Market Trade Example
While spread betting and CFD trading use leverage, buying and selling shares does not. If you want to speculate on a stock such as Vodafone in this way, you will own the shares out right. This also means you are subject to capital gains tax and stamp duty.
However, unlike with spread betting and CFDs, you will not have to pay nightly fees (swaps) to keep the trade open. You can also claim losses on your tax return.
If you purchase 1000 shares in VOD (Vodafone) at 80p, you would have to put up the total amount, which is £800.
Then you would be charged a commission (usually 1% or a fixed fee), then stamp duty at 0.5%. So, to buy 1000 VOD shares, you would have to pay £812.
If the market rises in your favour, you can sell the VOD shares to the market. If the VOD shares have risen to £1, you have made a nice 20p profit per share before costs and taxes.
After selling 1000 VOD shares at £1.00, you will have received £1000 before costs.
The stock broker will then charge 1% (£10 commission), leaving you with £990, and a £190 profit. The £190 made is then subject to capital gains tax, up to 20% of the profits.
While stock market trading has certainly made some traders a lot of money, this example does illustrate why you may prefer to go with the shorter-term spread betting option.
How To Manage Risk When When Spread Betting?
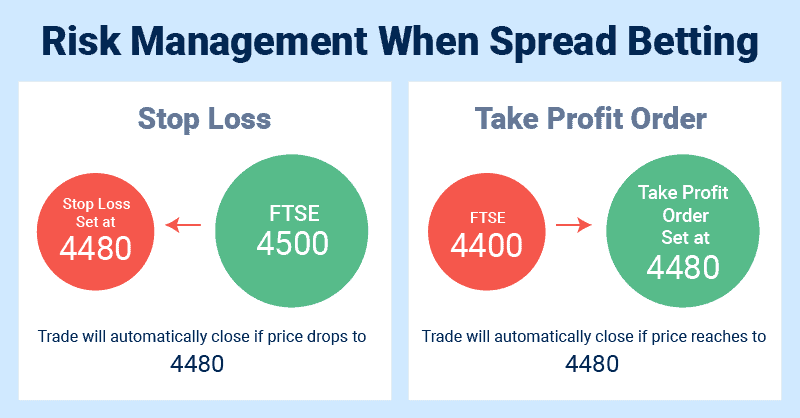
To manage risk when spread betting, we recommend you use a range of tools, such as stop-loss and take-profit. We’ve broken down each tool you can use in risk management, below.
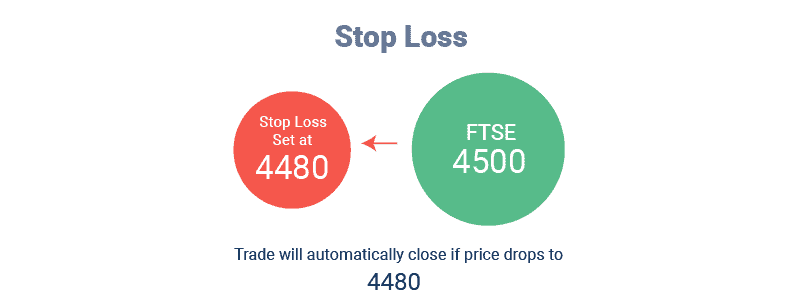
1. Standard stop-loss orders
A stop-loss order automatically closes your position at a level you request when the market moves against you. We recommend you learn how to spread bet effectively with stop-loss orders before deploying them on live trades, as they can limit your exposure to the markets.
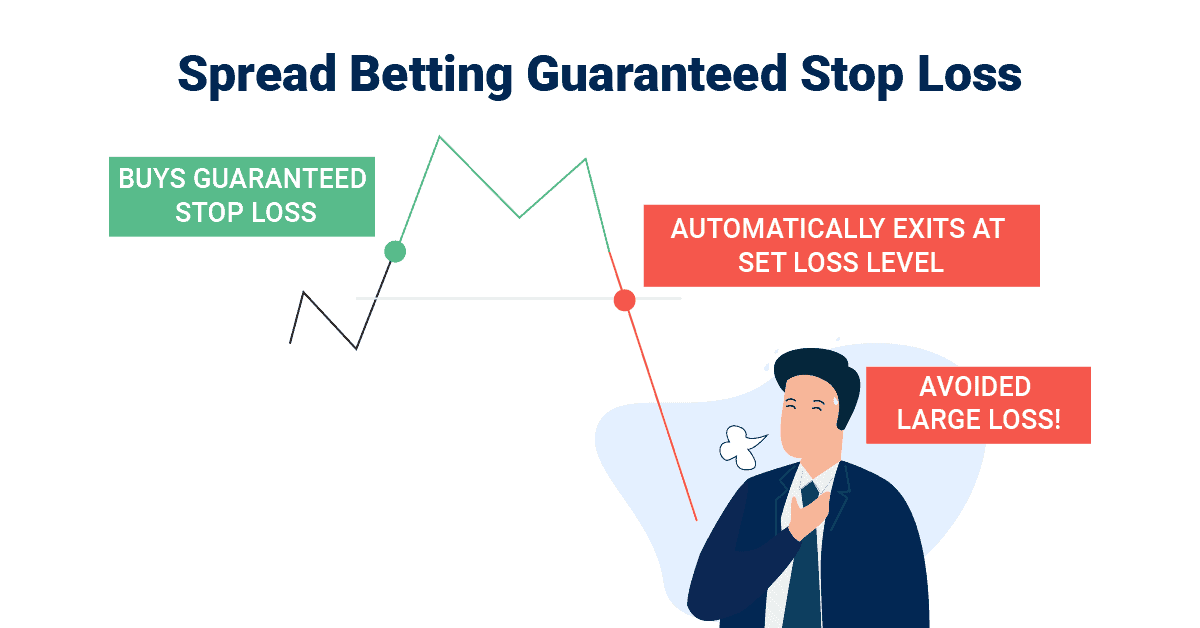
2. Guaranteed Stop-Loss Orders
The critical difference between guaranteed stop-loss orders (GLSOs) vs. standard stop-loss orders is that standard stop-loss orders can slip, which can end up costing you more money.
Meanwhile, with GSLOs, you pay a small premium for the spread betting broker to take you out at the GSLO price, no matter what. So if the market is highly volatile, and slips below your stop-loss level, you won’t need to worry – you’ll close out your trade at the level you set.
We should point out here that you won’t have to pay the premium if the GLSO is not used.
3. Take profit orders
A take-profit order will automatically close your position if the price rises to a pre-set point. This helps you keep to your trading strategy, and spread bet sustainably.
4. Hedging
Hedging involves limiting risk by opening opposing positions that balance out wins and losses. Assume that when the dollar’s value rises, the euro’s value falls. In that case, you may want to hedge a large USD/JPY position with a EUR/GBP position, to protect against possible losses.
5. Margin Calls
Margin calls are a little different, because you won’t deploy them yourself. Instead, the broker will automatically close the position if you run out of margin on an open bet.
Another risk management tool you won’t deploy yourself is negative balance protection. This means the broker will close your position if your balance reaches zero, so you don’t end up owing funds. All FCA-regulated brokers are required to provide this.
Trading Shares vs. Spread Betting
Traditionally, trading shares means owning the stocks and reaping their benefits, such as shareholder voting rights and dividend payouts.
If you actually own the shares, you are not charged a nightly rollover fee for holding them. With spread betting, you are charged this fee. Despite this, traditional share dealing involves paying more in trading fees and associated costs, including the spread, commission, stamp duty and capital gains tax. With spread betting, you’ll only pay the spread in most cases.
With traditional share dealing, you’ll only be able to profit if your market rises. Spread-betting , however, lets you bet on the market direction, so you could profit in both rising and falling markets.
Benefits Of Spead Betting
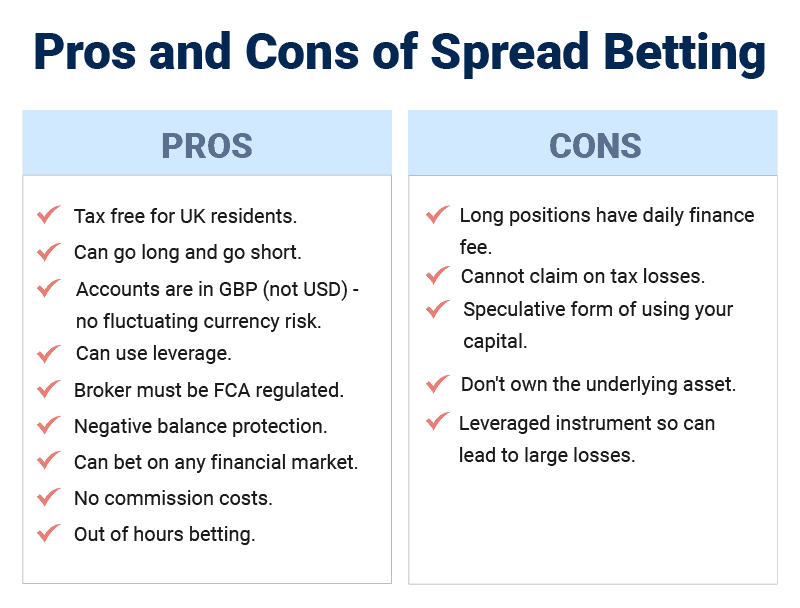
In our view, spread betting has many advantages compared to other products like CFDs and traditional forms of trading. These include:
Tax-Exemption
Based on UK tax laws, spread betting is exempt from stamp duty and capital gains tax, making it an attractive alternative to CFDs.
24 Hour Markets
Spread betting brokers provide access to spread betting markets 24 hours a day between Sunday evening and Friday close, allowing you to spread bet even with a full-time job.
GBP Staking
By spread betting in GBP, you can avoid currency conversion fees when speculating on foreign markets like the S&P 500, BMW shares, or EUR/USD, helping you reduce your costs further.
Leverage
Leverage allows you to control larger position sizes with a smaller spread betting account. It can amplify your wins, so you can potentially make a significant profit even from smaller market movements throughout the day.
Bear in mind the leverage also amplifies your losses too, should the market move the wrong way.
We have provided a pros and cons table below, to give you a quick comparison. We have also put together an additional page of spread bet tips to help you improve your chances.
What Are The Features Of Spread Betting?
We believe there are three key aspects you need to understand before making your first trade.
1. The Spread
The spread is the difference between the buy price (bid price) and the sell price (ask price), which the broker quotes you on their spread betting platform. The spread is the fee you pay the broker to enter the markets.
Our senior analyst Ross Collins had this to say about spreads:
“The tighter the spread, the cheaper it is to bet on it,” Ross said.
“This is one reason we recommend brokers like Pepperstone, who delivered the lowest spreads in our tests and came out as our best spread betting broker overall.”
2. Bet Size
The bet size (sometimes called ‘stake’ size) will affect how much profit or loss you will make. Every point that the price moves will multiply how much you gain or lose from the bet.
So if your bet size is £10 per point, your profit or loss will increase or decrease by £10 for each point the market moves.
SpreadBet co-founder Noam Korbl offers his own recommendation for bet sizes:
“When I first started spread betting, I started small with 50p per point bets,” he says.
“This was ideal as it allowed me to get used to how spread betting worked, without exposing myself to too much risk early on. I still recommend using a demo account to practice first, however, before you risk any money at all.”
3. Bet Duration
The most common spread bet duration is daily funded bets (DFBs). They are designed for short-term positions with lower spreads, and are subject to overnight funding costs.
Quarterly bets are less common, but you may encounter them. They expire at the end of each quarter, and have wider spreads, but they avoid the overnight funding fees of daily funded bets.
There are also binary bets, which are fixed term.
What Financial Instruments Can You Spread Bet On?
Spread betting offers a range of financial instruments for you to speculate on; these include:
1. Forex
Forex spread betting is one of the most popular markets as it has lots of liquidity. You can bet 24/5 with low spreads, making it attractive for day trading.
2. Shares
You can speculate on shares from global markets, including shares from the US, EU, Asia, and the UK. Most shares available for spread betting are from popular markets, such as the FTSE 100 and S&P 500.
3. Indices
Indices spread betting allows you to speculate on an index, such as the FTSE 100, S&P 500, Dow Jones, or DAX 40.
4. Commodities
All spread betting companies provide access to commodity markets, which include gold, silver, natural gas, and oil.
5. Interest Rates
Not as popular as some of the others on this list, spread betting on interest rates just means you are betting which way a specific interest rate will move.
Origins Of Spread Betting
Financial spread betting was introduced to traders in the 1970s by an investment banker called Stuart Wheeler. Stuart was the founder of IG Group, which still features highly on our best spread betting broker list.
The first spread betting market in the UK was used to speculate on the price of gold, but over the years, it has expanded and can now be traded on any market – from forex to stocks.
Spread betting is classified as a financial product, and this regulatory structure ensures consumer protection and market integrity. Despite this, it is still considered a form of gambling by
His Majesty’s Revenue and Customs (HMRC), hence its tax status.
You can learn more about the history of spread betting and popularity on our statistics page. Also, you can explore the origins of our own website and our merger with Learn Money, right here.
FAQs
What Is Financial Spread Betting?
Spread betting is a form of derivative trading used in financial markets like shares and commodities. It allows you to profit from rising or falling markets without owning the underlying market. Learn more on our spread betting meaning page.
What Can I Spread Bet On?
You can spread bet on various markets, including forex, indices, stocks, commodities, ETFs and bonds. Essentially, you can bet on any financial market, since all that is required is an underlying instrument to use for pricing.
You’ll find that the best spread betting company candidates will offer a decent range of markets to spread bet on.
How Are Spread Bets Taxed?
In the UK, spread betting is exempt from capital gains tax and stamp duty because it is listed as a gambling product instead of an investment vehicle.
How Does Spread Betting Arbitrage Work?
Spread betting arbitrage is a strategy used to lock in profit by taking advantage of price discrepancies across brokers. To do this, you would need to have a trading account with several brokers with MetaTrader 4 and have enough funds to cover the arbitrage in each of them.
What Is The Difference Between Spread Betting And CFDs?
The core difference between spread betting and forex or CFD trading is that spread betting is exempt from stamp duty and capital gains tax, which makes it attractive to traders. Meanwhile, CFDs are only exempt from stamp duty, but are subject to CGT.
How Do Dividends Affect Spread Betting Positions?
When a company pays dividends, the share price will fall a little. On a long position, brokers should credit your account to reflect this. The dividend value will be deducted from your account if you are short. In either instance, the dividend should not impact your position.
How Much Do I Need To Start Spread Betting?
We advise you to start trading with at least £1,000 to £2,000 if you are a beginner. However, some beginner-friendly spread betting platforms have lower minimum deposits, from £0 to £250.
It is always recommended to only trade with an amount of money you can afford to lose. You should use a spread betting demo account to practice before you start risking money for real.
Is Spread Betting The Same As Day Trading?
Spread betting is not the same as day trading, but you can day trade as a spread bettor. Day trading simply means you open and close your position on the same day, and you can do this with traditional share trading, CFD trading, or spread betting.
You can hold your spread betting position open for longer than a single trading day if you like, but you will be charged for this. This is why spread betting day trading is more popular.
How Can I Hedge With Spread Betting?
You can hedge with spread betting in several ways, but the most popular is to hedge against falling share prices. You can use a spread bet to short the share price, which locks in profits and protects them from losses during the downturn.
Is Spread Betting Gambling?
Legally speaking, yes, spread betting is considered gambling, because the HMRC classifies it as such. This is what makes spread betting tax free for CGT.
However, it is regulated by the Financial Conduct Authority, due to the underlying markets involved (real-world assets like shares, forex, etc.). This reflects the fact that it takes skill, not just luck, to speculate on the markets. We recommend considering a course or practicing on a demo account before you risk any of your own money for real.


Ask an Expert
How do you make money with spread betting?
You make money by betting on whether the market will move up or down and if it goes in your favor, you profit.